The first time I mention EDA (Exploratory Data Analysis) or Data Exploration to people who want to tell stories with data, I see expressions of confusion. I can totally understand why. I have been working with data for over 6 years now, (including an advanced degree in Data Science) and I still get overwhelmed when I see a new problem statement and data for the very first time.
For those days, I use QUITE a framework to structure the data exploration process and translate my findings into a story. I created this framework when I was teaching a group of students how to apply first principles to data exploration. Before jumping to the QUITE framework, I will start by talking a bit about First Principles.
First Principles
A first principle is a basic assumption that cannot be deduced any further. Aristotle called it “the first basis from which a thing is known.” (Source). In other words, First principles thinking is the act of boiling a situation down to the fundamental parts that you know are true and building up from there. With first principles thinking, the problem-solving process begins with questions like, “What are we absolutely sure is true? What has been proven?” (Source)
It was posited by Aristotle and has been used by great inventors. Gutenberg utilized the first principles to create the first printing press that increased the accessibility of information and helped us get physical books in our hands. He boiled the process of printing down to its fundamental parts: movable type, paper, and ink. Then, he combined these foundational pieces with a screw press, a device used by winemakers at the time, to create the printing press.
Musk is one of the biggest proponents of First Principles Thinking in modern times. In his early days of realizing his dream to reach space, Musk discovered the cost of purchasing a rocket was astronomical—up to $65 million. Given the high price, he began to rethink the problem. Instead of buying a finished rocket for tens of millions, Musk decided to create his own company, purchase the raw materials for cheap, and build the rockets himself. SpaceX was born.
Within a few years, SpaceX had cut the price of launching a rocket by nearly 10x while still making a profit.
These stories would have helped you realize the importance of using first principles, but you might be wondering how to use them in Data Science.
How can I use First Principles in Data Exploration?
Data Exploration offers ample opportunity to be creative. Creativity means you use first-principles thinking and use it to break down the problem statement into its fundamentals. A good data exploration marries business knowledge with insights from data. In general, Data Science is about combining domain expertise with codes and the good amount of data that you have.
First Principles help you create a better synergy of business problems and data. You can break the large problem statement into its constituents that are so fundamental that cannot be broken further. This can be used to then build the solutions to answer the large, pressing problem statement.
The QUITE framework
Q: Quickly scan through the problem statement and end goal
U: Understand the underlying concepts in detail
I: Ideate and formulate the hypothesis
T: Tour the data and test your hypothesis
E: Explain your findings
Let’s understand with an example.
Pulmonary Fibrosis Data Exploration
Suppose you are given a problem statement that is to predict pulmonary fibrosis using patient data. You have this dataset provided to you:

Step 1
The project aims to predict the onset of pulmonary fibrosis in a patient using their history of FVC (Forced Expiratory Volume) of the lungs. The end goal is to create a machine-learning model with high accuracy and recall.
Step 2
This step is U in the QUITE framework. You will want to start by understanding what is pulmonary fibrosis, what are the symptoms, what are the causes, and the risk factors.
The word “Pulmonary” means lung and the word “fibrosis” means scar tissue— similar to scars that you may have on your skin from an old injury or surgery. So, in its simplest sense, pulmonary fibrosis (PF) means scarring in the lungs.
Over time, the scar tissue can destroy the normal lung and make it hard for oxygen to get into your blood. Low oxygen levels (and the stiff scar tissue itself) can cause you to feel short of breath, particularly when walking and exercising. Pulmonary fibrosis isn’t just one disease. It is a family of more than 200 different lung diseases that all look very much alike.
The symptoms include:
- Shortness of breath
- A dry cough
- Fatigue
- Unexplained weight loss
- Aching muscles and joints
- Widening and rounding of the tips of the fingers or toes
Risk factors include:
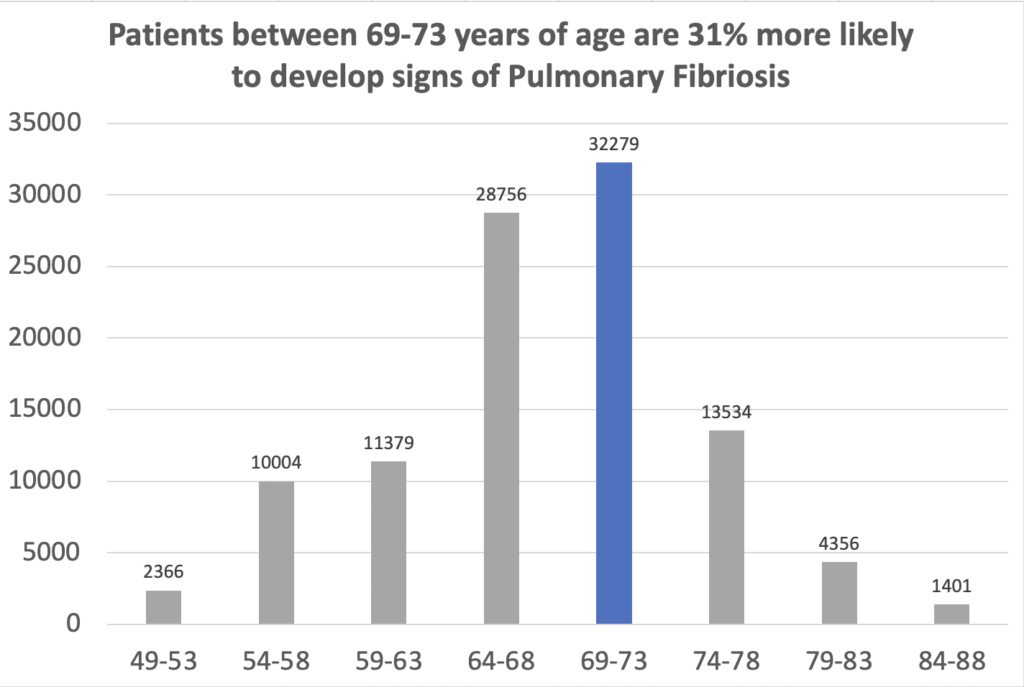
- Age. Although pulmonary fibrosis has been diagnosed in children and infants, the disorder is much more likely to affect middle-aged and older adults.
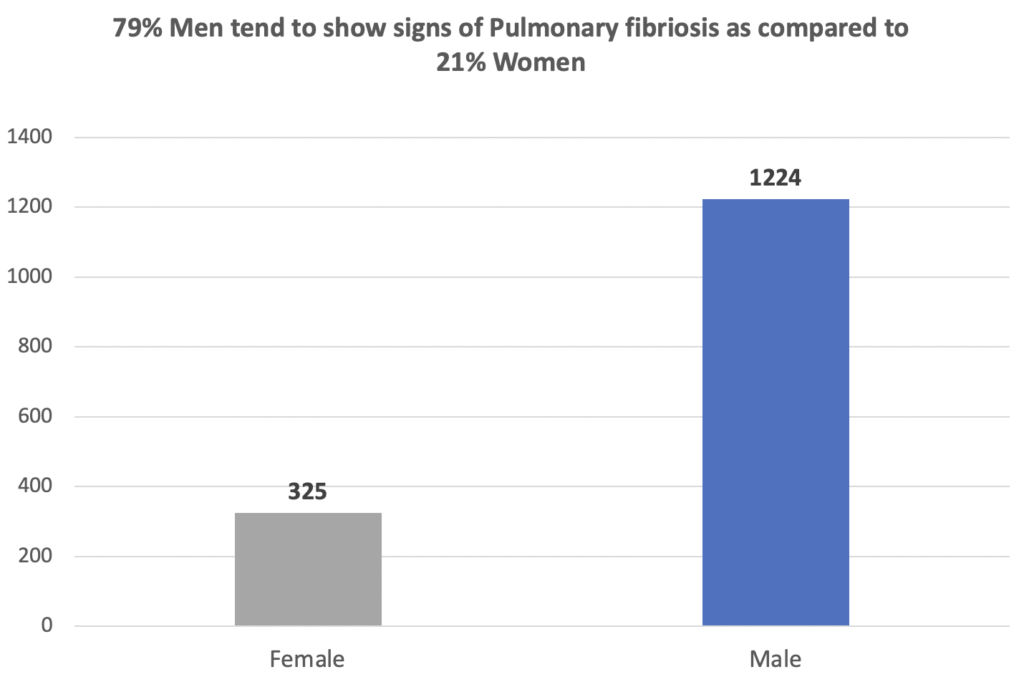
- Sex. Idiopathic pulmonary fibrosis is more likely to affect men than women.
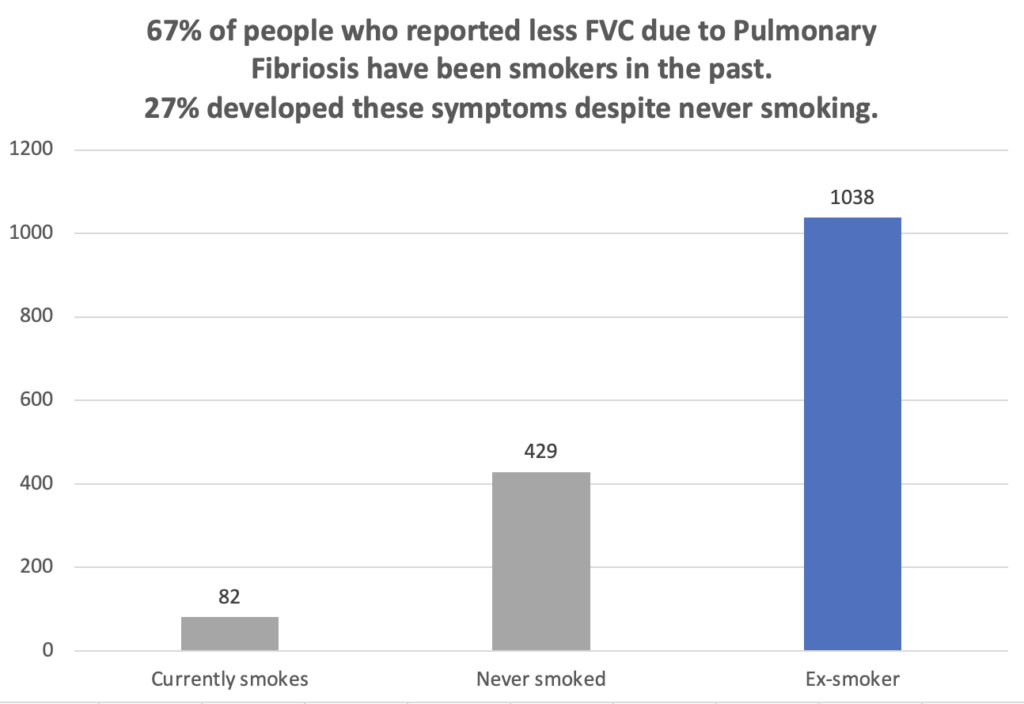
- Smoking. Far more smokers and former smokers develop pulmonary fibrosis than do people who have never smoked. Pulmonary fibrosis can occur in patients with emphysema.
- Certain occupations. You have an increased risk of developing pulmonary fibrosis if you work in mining, farming, or construction or if you’re exposed to pollutants known to damage your lungs.
- Cancer treatments. Having radiation treatments to your chest or using certain chemotherapy drugs can increase your risk of pulmonary fibrosis.
- Genetic factors. Some types of pulmonary fibrosis run in families, and genetic factors may be a component.
Step 3
This step is to ideate and formulate some initial hypotheses. You can always create new hypotheses while you are exploring this and continue testing them. Some basic hypotheses that we can formulate are:
- Older patients are at higher risk of getting pulmonary fibrosis
- Smokers have a high risk of getting pulmonary fibrosis
- Men tend to be smokers more than women, so they would be at a higher risk
Step 4
There are different tests you can perform depending on the data. Parametric and Non-parametric tests depend on various parameters. If you have continuous data, parametric tests like t-test would be suitable and in case of comparing categorical variables, you can make use of Mann–Whitney U test.
Step 5
Some findings expressed as visuals


While presenting your findings, try to include visuals to help your story flow. To learn best practices for better visualization, refer to this guide: Storytelling with Data: A Data Visualization Guide for Business Professionals by Cole Nussbaumer Knaflic.
I hope you found the QUITE framework helpful and will use it when you are exploring the data.